Discover current video streaming trends, consumer behaviors, and competition among AVOD, SVOD and FAST services to uncover what might come next in the video streaming battleground.
Consumer Streaming Adoption
The Era of Re-bundling
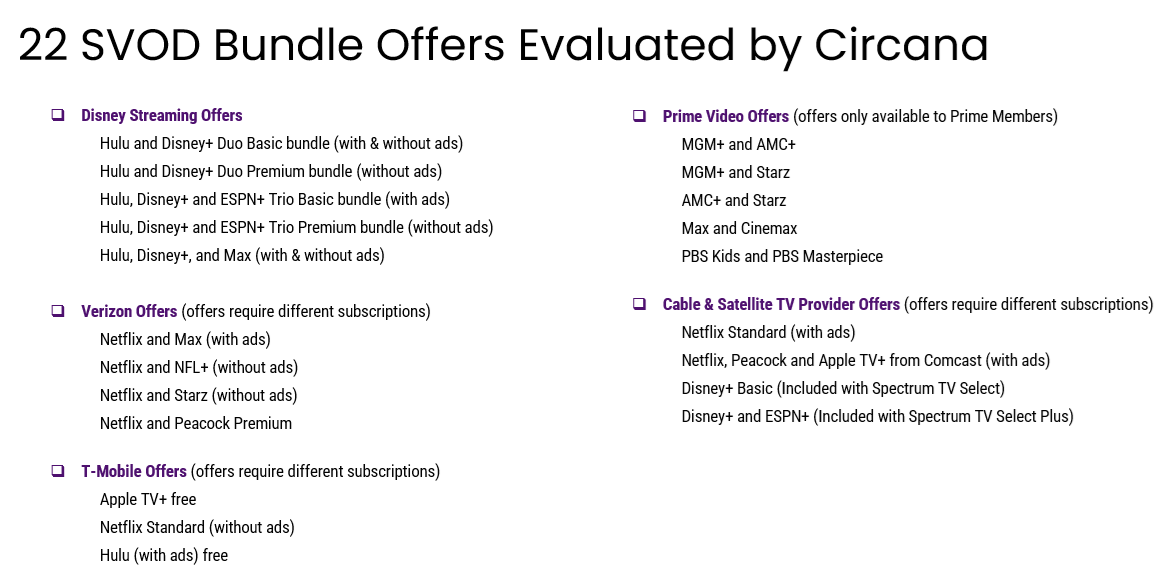
- According to Circana’s latest TV Switching Study, 2024 saw the return of the bundle:
- 14.2 million households reported cancelling an SVOD service after the TV series or movie they signed up for ended (Circana’s TV Switching Study, 2024)
- 23% of households already subscribe to one of the currently available discounted SVOD bundles above (Circana’s TV Switching Study, 2024)
- 25% of households say they are likely to sign up for one of the currently available discounted SVOD bundles above in the coming six months (Circana’s TV Switching Study, 2024)
Bundling Opportunities Go Beyond Video
High appeal exists for consumers in product, service & subscription bundles—particularly with Internet, retail, telecommunications and music products and services:
- At least six out of ten of consumers find mobile service (66%), retail membership (63%) or audio services (60%) to be the most important in bundle considerations followed by about half finding gaming (47%), home security (45%) and food delivery services (45%) important. (Content + Connectivity Consumer Insights, 2024)
- Rounding it out, education and learning services (40%), health and exercise (39%) and fantasy sports and gambling services (33%) are found to be the most important in bundle considerations. (Content + Connectivity Consumer Insights, 2024)
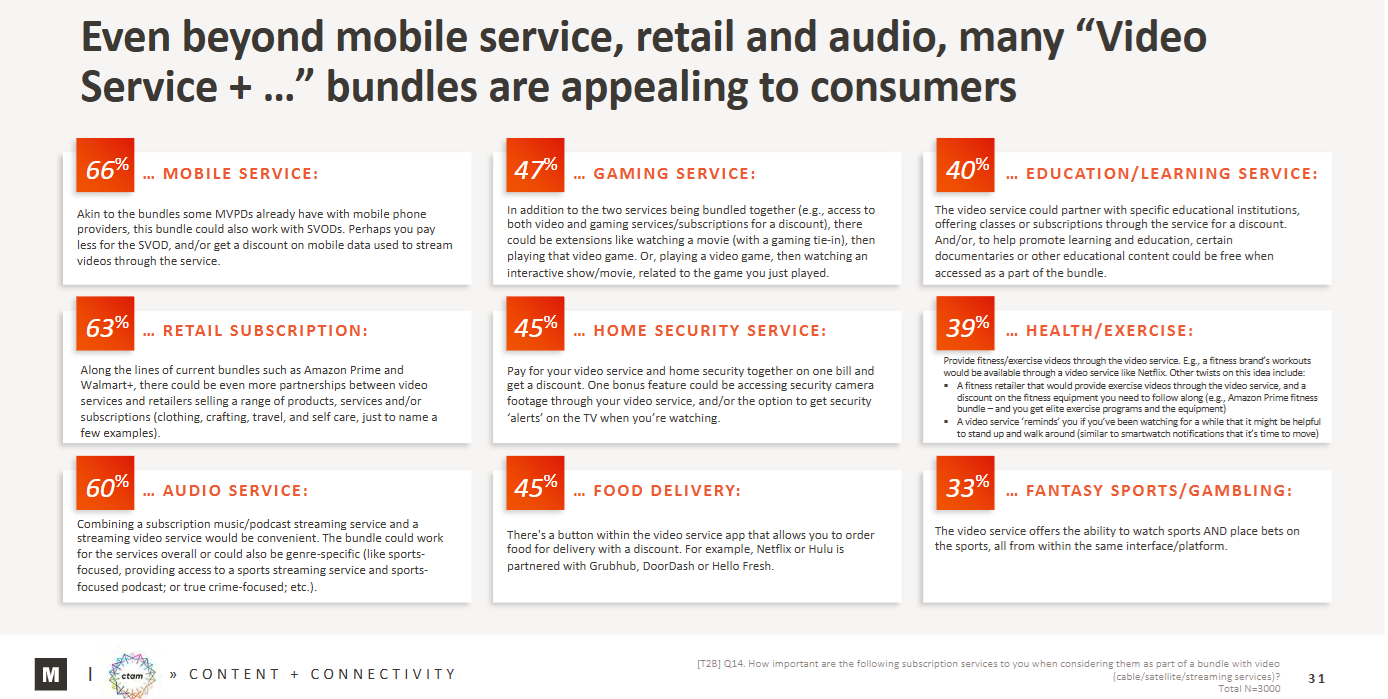
*Consumers that find this subscription type to be the most important in bundle considerations (2024)
Streaming Adoption
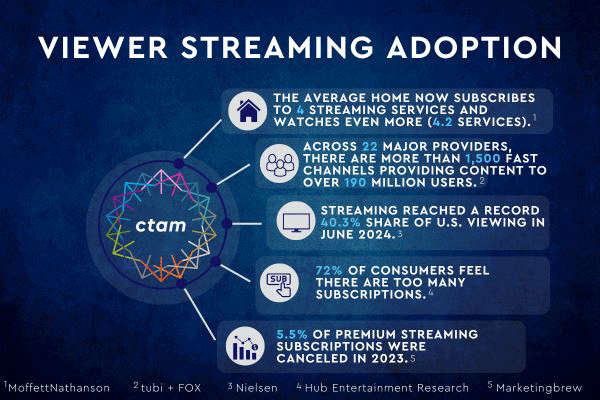
- The launch of new streaming platforms in the U.S. and Canada slowed in 2024, with only 36 new services compared to 59 in 2023.
- The total number of available streaming platforms increased to 745, even as 40 platforms were discontinued, up from 27 in 2023. (BB Media Study, 2025)
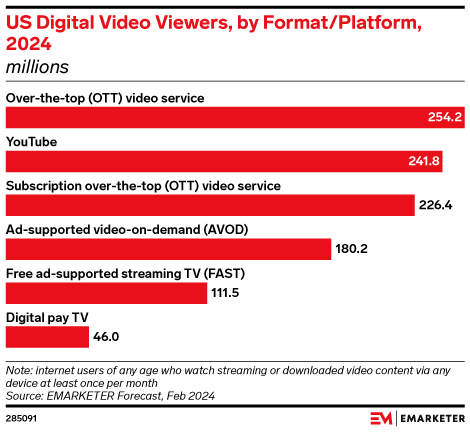
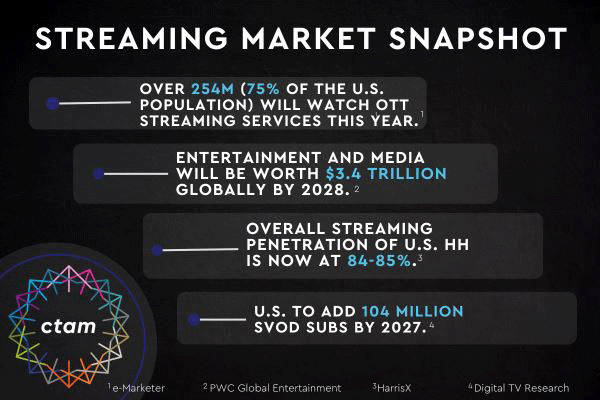
- Over 254M (75% of the U.S. population) will watch OTT streaming services this year including SVOD, AVOD and FAST services. (e-Marketer, 2024)
- The number of global OTT service subscriptions is expected to increase from 1.6 billion in 2023 to 2.1 billion by 2028. (PWC, July 2024)
- The U.S. average number of streaming subscriptions per household is now at 5.1 — second globally overall only compared to India. (BB Media Study, 2025)
- Average Number of DTC Streaming Services by Age (Leichtman Research Group, 2023)
- A18-44: 4.8
- A45-54: 4.0
- A55+: 2.5
- Netflix is the streaming service with the most subscribers (247.2 million)* followed by Amazon Prime Video (200M) and Disney+ (150.2M) (Digital Trends, 2024)
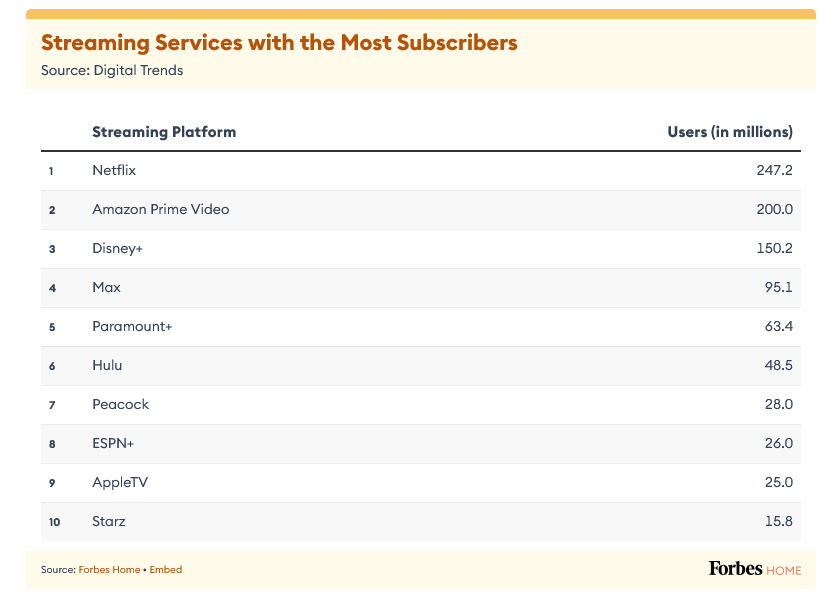
*Note: Disney’s latest Q3 2024 number is 153.8M
The actual Q2 ending number reported in the trades is 277.6 for Netflix
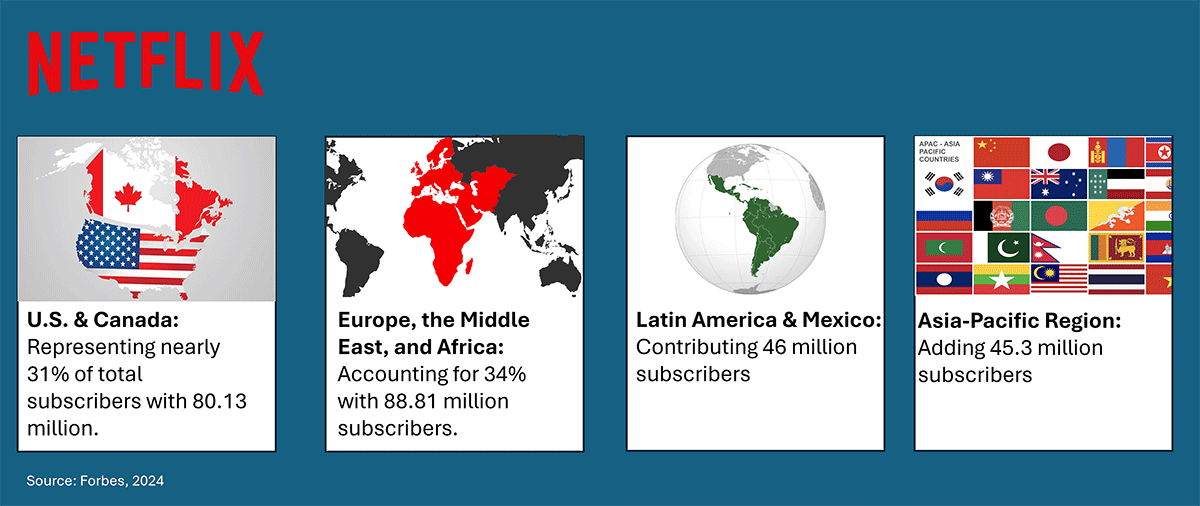
- Netflix is currently the most subscribed video streaming service, with 260.28 million subscribers worldwide. (Forbes, 2024)
- The increase in content across global SVOD services includes approximately 3,000 movies, 2,000 TV shows and 500 sports shows. (Gracenote, 2025)
- Overall, Amazon Prime Video remains the largest distributor of video content, offering nearly 69% of the available programming, up from 67.8% in Q1 2024. (Gracenote, 2025)
- Drama remains the top genre across the five services, but it has dropped from the No. 1 position on Disney+, where it has been overtaken by documentary, comedy, children and adventure.(Gracenote, 2025)
- 84% of consumers cite ease of content discovery as important for choosing to subscribe to a video/service provider. (CTAM, Magid Research, 2024)
- Over the past two years, fewer consumers (37% in 2025 vs. 41% in 2023) report signing up for a new service just to watch a specific show. (Hub Entertainment Research, Evolution of Video Branding, 2025)
- While 58% of consumers knew that Stranger Things is on Netflix, fewer could correctly identify where to watch shows like The Bear (Hulu), Game of Thrones (MAX) and Ted Lasso (Apple TV+). (Hub Entertainment Research, Evolution of Video Branding, 2025)
Streaming Media Devices
- 90% of U.S. Internet households use smart TVs and streaming media players as their primary viewing devices with gaming consoles and smart Blu-ray Disc players getting increasingly squeezed out. (Parks Associates)
- Smart TVs vs. Streaming Media Players (Parks Associates, 2024)
- 68% of U.S. Internet households own at least one smart TV
- 46% of U.S. Internet households own at least one streaming
media player
- Roku is the most popular brand of streaming media players, followed by Amazon’s Fire TV. (Parks Associates, 2024)
- 43% of consumers report using Roku most often
- 35% of consumers report using Amazon Fire TV most often
Streaming Costs & Churn
- 45% have canceled a streaming subscription within the last year because costs were too high. (Forbes, 2024)
Streaming Usage & Perceptions
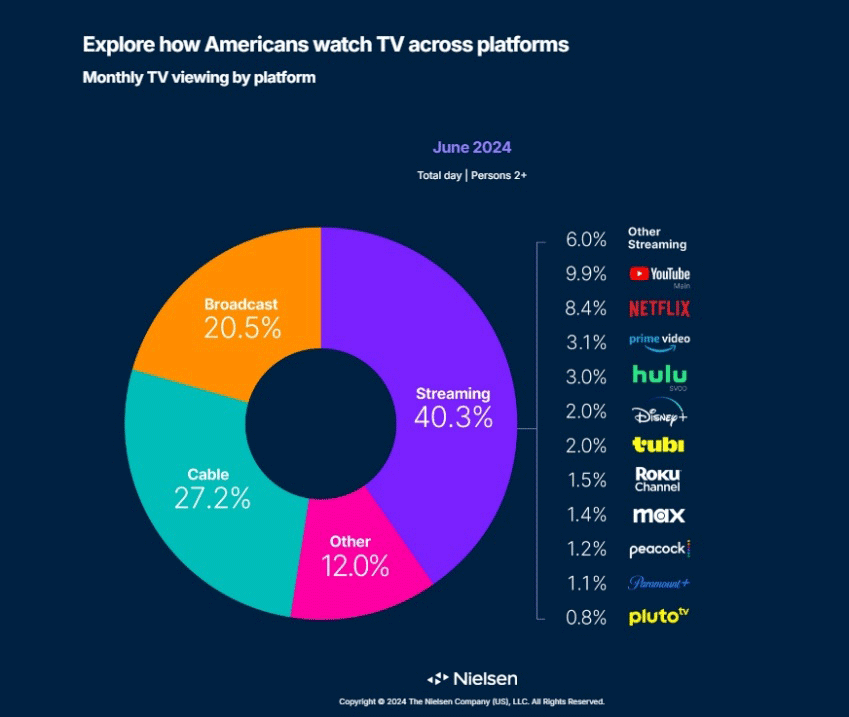
- Streaming reached a record 40.3% share of U.S. viewing in June 2024. (Nielsen)
Aggregating Streaming Networks
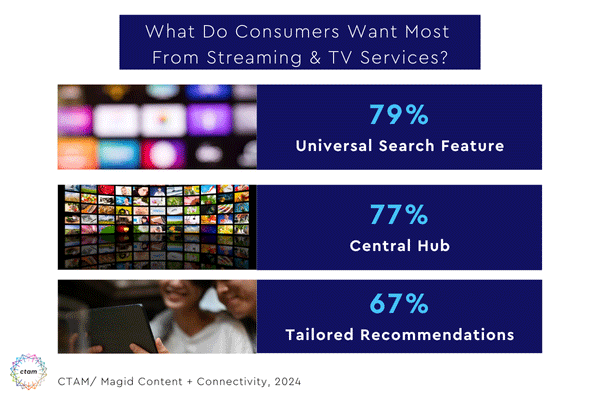
- Consumers express specific interest in universal search features, a central hub and tailored recommendations when it comes to streaming and TV services. (CTAM/ Magid Content + Connectivity, 2024)
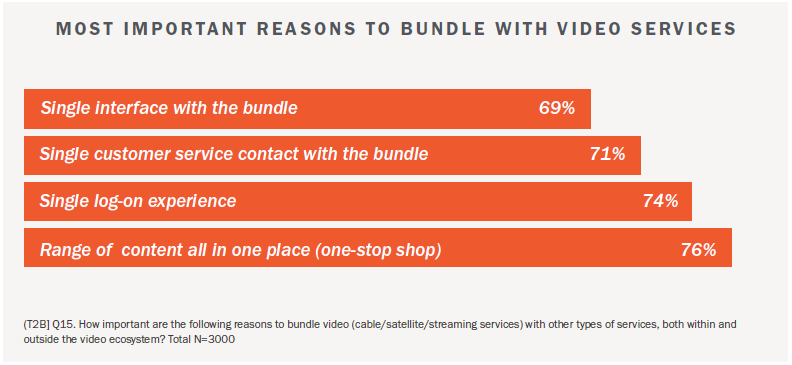
- Bundling services offer numerous benefits for consumers such as consolidating bills, content, and log-ins into a single point of access. (CTAM/ Magid Content + Connectivity, 2024)
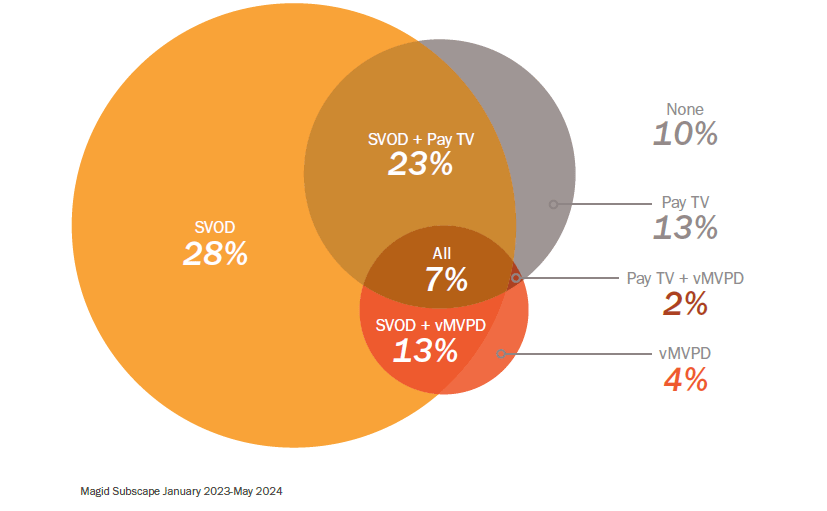
- Instead of subscribing to more services, consumers are bundling what they already have with 45% of consumers self-bundling Pay TV with SVODs—whether it’s MVPD + SVODs, mMVPD + SVODs, or other combinations. (CTAM/ Magid Content + Connectivity, 2024)
Consumer Subscription Behavior
(Bango’s Subscription Wars—Super Bundling: Global Trends, 2024)
- 1 in 3 U.S. subscribers now pay for a service they never use
- 35% have lost track of how much they spend on subscriptions each month
- The trend is not a uniquely U.S. subscriber issue, as Latin American and European subscribers also find it hard to keep track of their subscriptions
- Three-quarters of U.S. subscribers report having a “forever subscription,” one that users never pause or cancel
- 54% of U.S. subscribers said they would spend more time using their subscription services if an all-in-one platform was available
Multicultural Streaming Trends

Understanding the evolving preferences of multicultural communities is essential for delivering content that resonates with diverse audiences, and to ensure that entertainment offerings are inclusive and relevant to their unique cultural needs.
Hispanics Are Top Streaming Adopters, Crucial Audience for CTV Advertisers
Survey finds Hispanics are one of the most avid adopters of streaming media and underscores their significance for CTV advertisers. (LG Ad Solutions’ The Inclusive Screen: Hispanic Americans, August 2024)
- 78% of Hispanic Americans prefer streaming to traditional TV, citing the following as primary reasons why:
- ability to watch at your own pace (82%)
- wider range of content options (69%)
- easier content discovery (62%)
- 43% of Hispanic CTV users report family/friends as a top source to find new content
- 37% point to specific app home screens and the TV screen homepages (33%) as top sources
- 4 in 5 Hispanic households watch a mix of Spanish and English language TV
- 69% of Hispanic CTV users prefer streaming free video content with ads instead of paying for a subscription without ads
- 41% of Hispanic CTV users reported searching online after seeing a streaming ad, while 40% visited a brand’s website
Asian American Viewers Value In-Language Content and FAST Channels
Critical Factors in Attracting Asian American Subscribers (Horowitz FOCUS Asian Volume I: Subscriptions 2024)
- 54% of Asian Americans watch at least some Asian-language content
- 45% say content from their country of origin or heritage is valuable for them
- 44% say international content is valuable for them
- 64% (of Asian-language dominant and bilingual Asian TV content viewers) say content in an Asian language or geared toward Asian American audiences is critical when considering which services to subscribe to for entertainment content
- 67% subscribe to at least one SVOD (with an additional 10% who have access without a fully paid subscription via password sharing or bundling)
Netflix and Amazon Prime Video top the list of most-used subscription streaming services among Asian American viewers. However, Asian-targeted SVOD services including Rakuten VIKI, OnDemandKorea, and ZEE5 that offer in-language content play a role in viewership.
- 73% of Asian American audiences overall (up from 23% in 2019) use FAST Channels
- 85% of Asian-language dominant viewers specifically use FAST channels
- Asian American viewers are more likely to use Samsung TV PLUS and XUMO than consumers overall
Hispanic Households Outspend and Outstream U.S. Average
Hispanic-identifying households are more inclined to pay for streaming services and maintain their subscriptions when the content aligns with their interests. (Parks Associates’ North American Streaming Video Tracker, July 2024)
- Spanish-speaking households in the U.S. outspend the average household on subscription streaming video services (SVOD) by about $20
- 96% of Hispanic-identifying households subscribe to at least one SVOD service, which is 8 percentage points higher than the average overall household
- Hispanic-identifying households use an average of 6 SVOD services, compared to slightly under 5 for the average household
- The average Hispanic-identifying household spends $96 per month on SVOD subscriptions, compared to $76 in the average U.S. household
The Ad-Supported Streaming Market
- About 33% of the U.S. population and 44% of over-the-top video viewers will watch free ad-supported streaming television (FAST) in 2024. (E-Marketer, 2024)
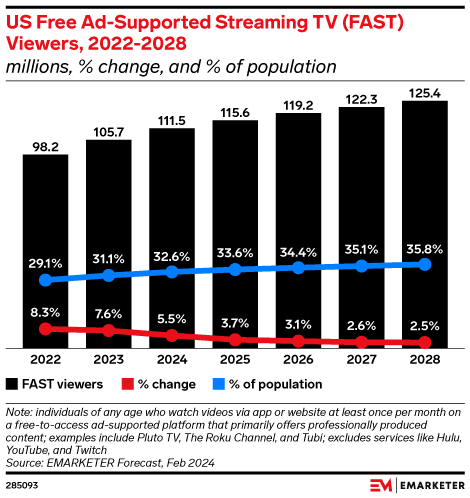
- FAST channels are expected to see a 5.4% increase in viewership this year with The Roku Channel taking the lead. (eMarketer, 2024)
- The number of unique FAST offerings are projected to increase this year, reaching 1,943 channels. (Deadline, 2024)
- Free ad-supported TV (FAST) channels like Pluto TV, Roku Channel and Tubi accounted for 4.3% of streaming, beating out Peacock, Max, and Paramount+, which totaled 3.7%. (Nielsen, 2024)

Ad Spending on Streaming Platforms
- Ads will provide nearly 28% of streaming services’ revenue by 2028. (PWC Global Entertainment and Media Outlook 2024-2028)
- Premium streaming platforms increased ad revenues by almost 50% year-to-year during the third quarter in 2024, reaching $3.8 billion. (MoffettNathanson, Q3 2024 Analysis)
Top Performers in Q3: MoffettNathanson, Q3 2024 Analysis
- Hulu: $782M (+5%)
- Peacock: $761M (+114%)
- Prime Video: $441M (+230%)
- Netflix: $429M (+95%)
- Roku Channel: $331M (+22%)
- Pluto TV: $272M (+18%)
- Tubi: $255M (+19%)
- Disney+: $141M (+180%)
Top Earners for 2024: MoffettNathanson, Q3 2024 Analysis
- Hulu: $3.1 billion
- Peacock: $2.1 billion
- Prime Video: $2.0 billion
- Netflix: $1.6 billion
- Roku Channel: $1.2 billion
- Pluto TV: $1 billion
Biggest Growth Platforms in 2024: MoffettNathanson, Q3 2024 Analysis
- Disney+: +261% to $531M
- Prime Video: +133% to $2.0B
- Netflix: +116% to $1.6B
- For the 11 top premium streamers, 2024 revenue estimates for AVOD platforms are projected to grow 39% to $14.3 billion. (MoffettNathanson, Q3 2024 Analysis)
- Notably, political advertising significantly boosted revenue for platforms like Max, Discovery+, Tubi, Pluto, and Roku. (MoffettNathanson, Q3 2024 Analysis)
Consumer Streaming Ad Perceptions
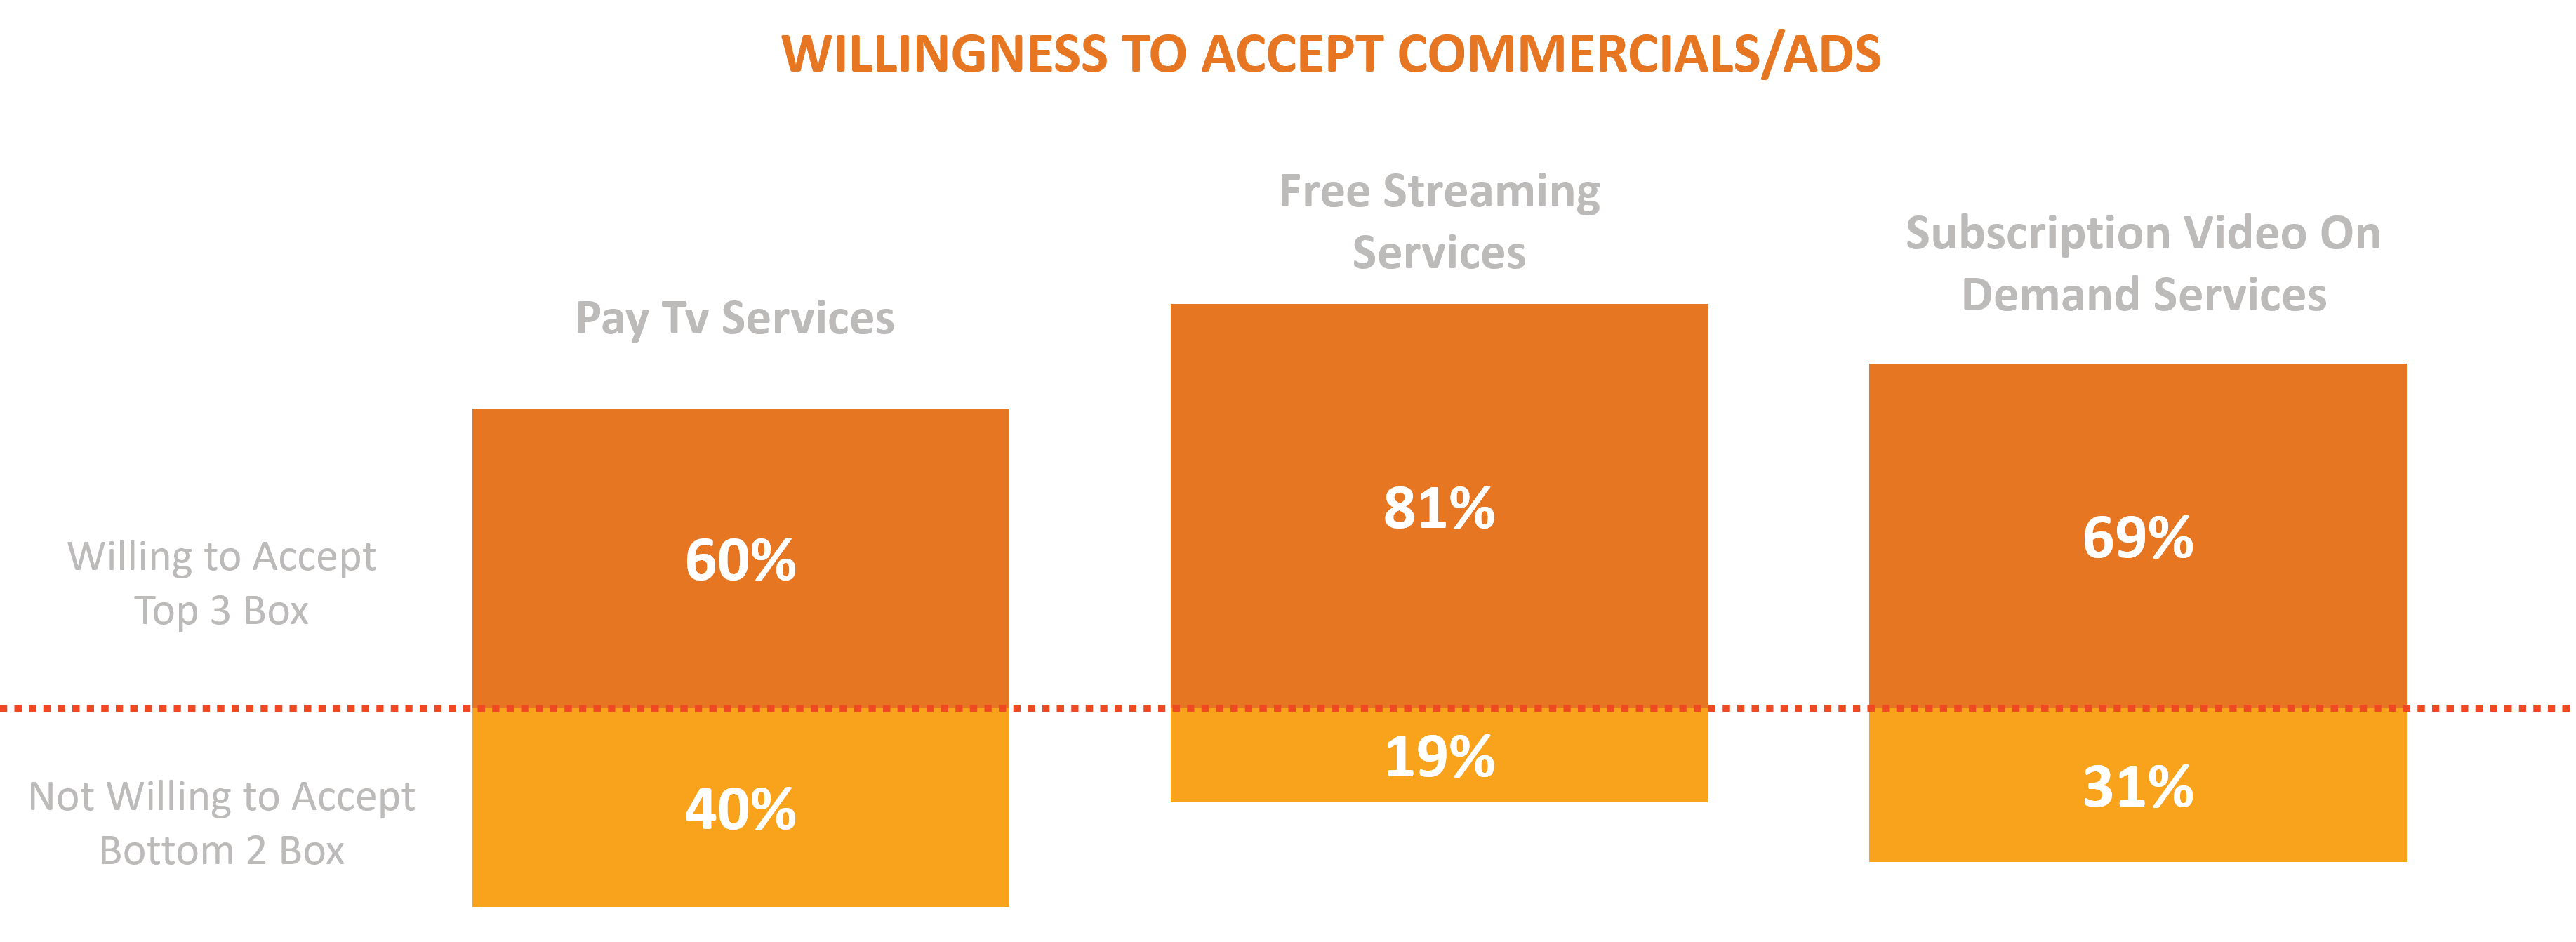
- Consumers understand the trade-off between free and commercials as 81% of free streaming service subscribers and 69% of SVOD subs are willing to accept commercials/ads. (Source: Magid’s Video Entertainment Pulse Study)
- 50% of streaming users pay for a streaming service without ads, with 24% reporting that they specifically pay to avoid ads and prefer an uninterrupted viewing experience. (Forbes, 2024)
- 26% are unsure whether their subscriptions include ads or not, suggesting a degree of ambiguity or indifference towards the presence of ads in streaming content. (Forbes, 2024)
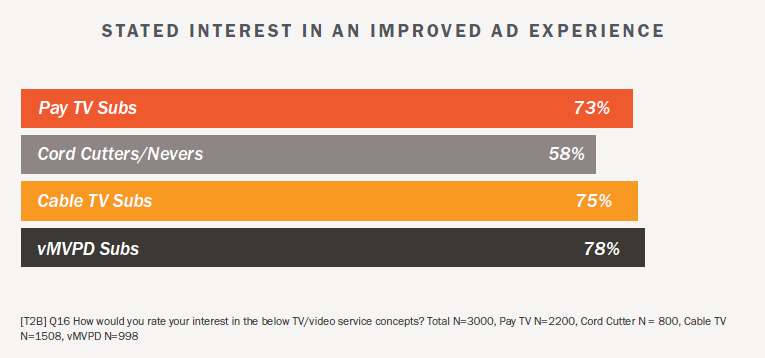
- Almost seven out of ten (69%) consumers are interested in having an improved ad experience—one that enhances their viewing and uses the capabilities of today’s technology. (CTAM/ Magid Content + Connectivity, 2024)
Streaming Live Sports
- Sports fans are just as likely to watch live games on streaming platforms (69%) as they are on broadcast (66%) or cable networks (63%). (Hub Entertainment Research, What’s the Score, 2025)

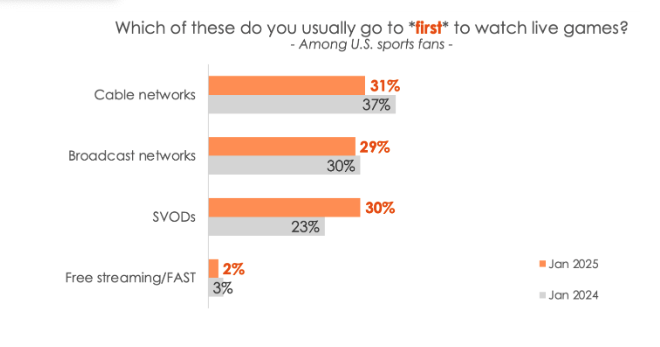
- More importantly, far more sports fans consider streaming their “home base” for live sports compared to one year ago (30% vs. 23% in 2024). (Hub Entertainment Research, What’s the Score, 2025)
- Currently, 30% of fans said a streaming platform is their *first* stop for live sports – a huge gain and essentially tied with cable (31%) and broadcast (29%). (Hub Entertainment Research, What’s the Score, 2025)
- Sports content significantly increased on SVOD services in Q1 2025 with more sports added to four of the five leading services and Disney+ and Netflix seeing the greatest increase with nearly +471% and nearly 100%+, respectively). (Gracenote, 2025)
- The five providers (Amazon Prime Video, Apple TV+, Disney+, Netflix and Paramount+) have collectively increased sports programs by more than 72% in 1Q 2025. (Gracenote, 2025)
- While Apple TV+ did not increase its sports content in 1Q 2025, that will change as the new MLS and MLB seasons get underway and live games air on the service. (Gracenote, 2025)
- With increased sports content on streaming services, there is also an increase in relevant metadata, such as synopses, scores, highlights and imagery to help streamers build world-class user experiences to keep users engaged beyond the live game. (Bill Michels, Chief Product Officer at Gracenote, 2025)
- In 2025, 69% said they watch at least some live games on SVOD platforms — on par with broadcast (66%) and cable networks (63%). (Hub Research: Media Play News, 2025)
- Far more sports fans consider streaming their “home base” for live sports compared to one year ago. Thirty percent (30%) of fans said that a streaming platform is their first stop for live sports — a huge gain and essentially tied with cable (31%) and broadcast (29%). (Hub Research: Media Play News, 2025)
Super Bowl 2025 Viewing
- Whether watching the Super Bowl on a traditional set-top box service or streaming the game on Internet-connected devices, over five out of six viewers (84%) watched the game at home and over three-quarters (77%) did so on a TV set, showing that the big screen remains the preferred platform for sports events such as this. (CTAM and HarrisX, Super Bowl LIX Viewing Experience Study, 2025)
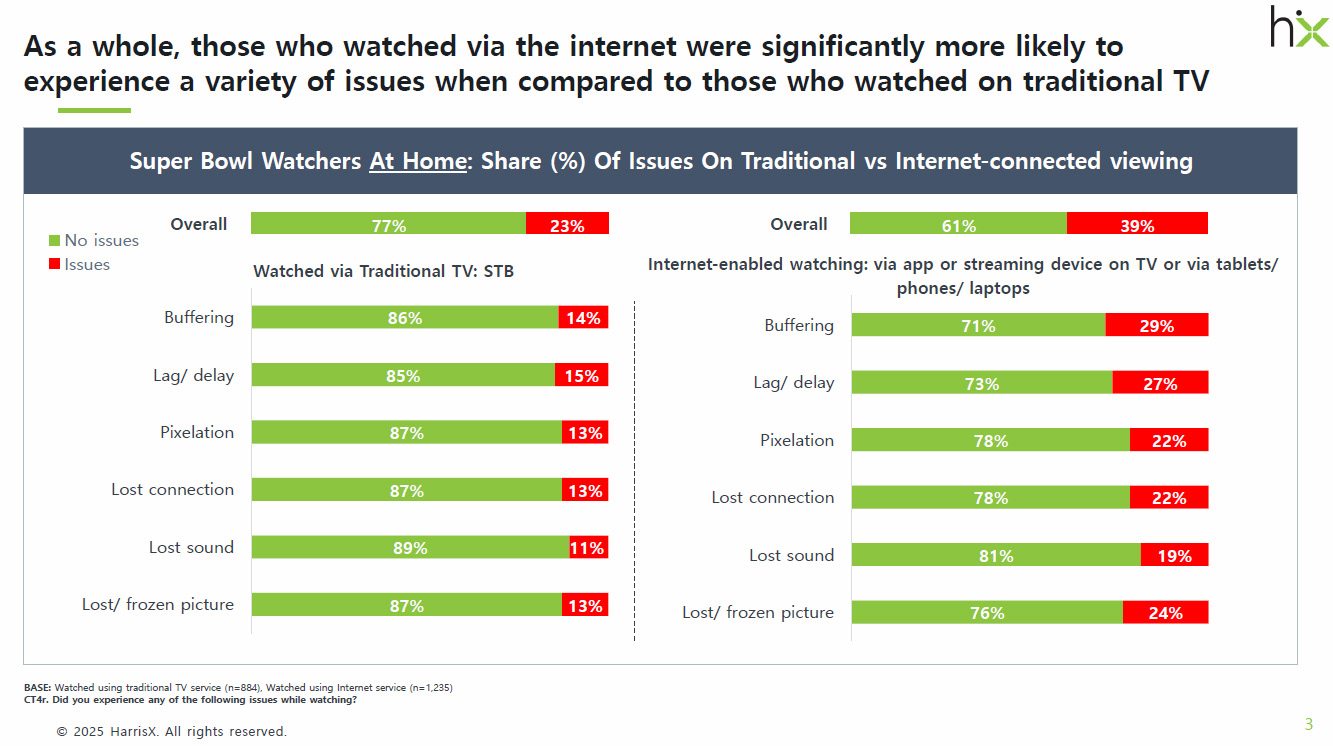
- While viewers were more likely to watch the Super Bowl at home on Internet-connected streaming services vs. traditional set-top box TVs, the superior experience continues to be watching on a “traditional TV” vs. streaming. (CTAM and HarrisX, Super Bowl LIX Viewing Experience Study, 2025)
- Watching the Super Bowl on “traditional TV” provided a superior experience than streaming the major event, with those streaming significantly more likely to experience a variety of issues. (CTAM and HarrisX, Super Bowl LIX Viewing Experience Study, 2025)
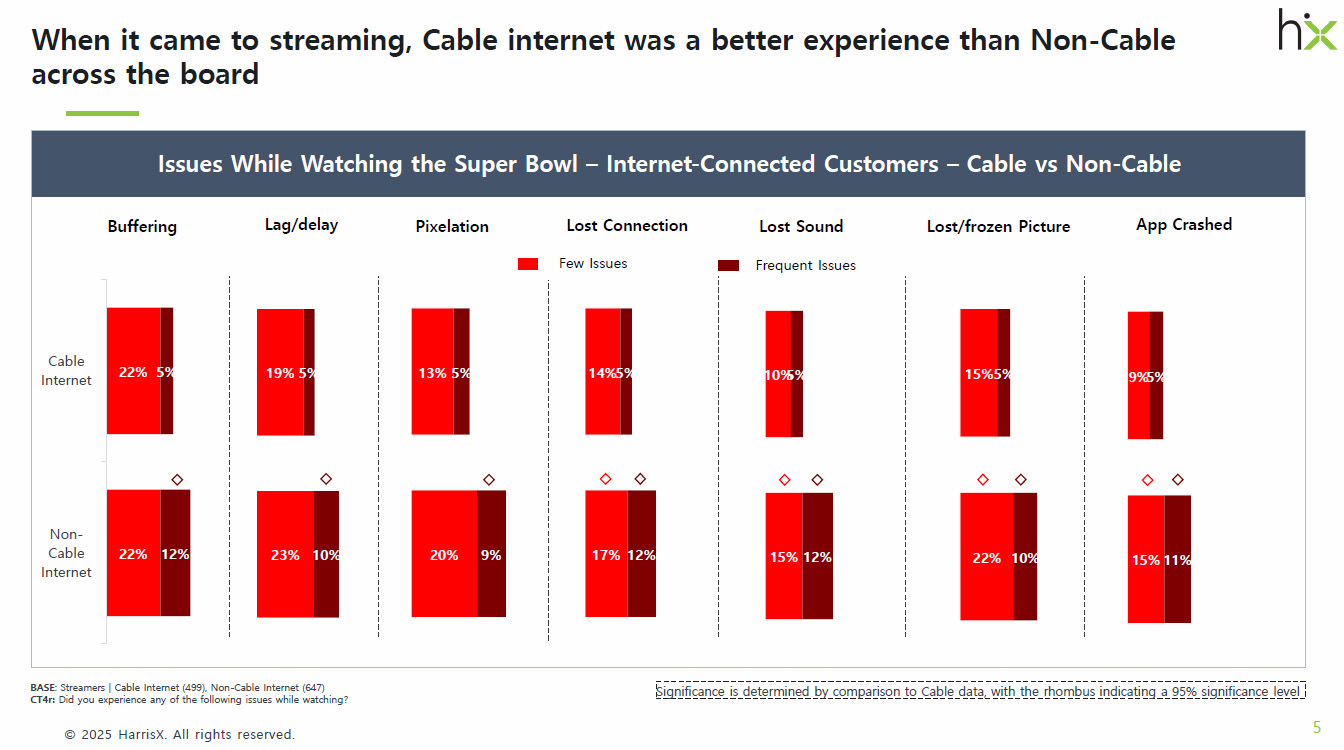
- Those streaming the Super Bowl reported a better experience when doing so on Cable broadband Internet services vs. those with non-cable Internet across the board – citing less issues with buffering, lag/delay, lost connection and lost sound/picture. (CTAM and HarrisX, Super Bowl LIX Viewing Experience Study, 2025)
eSports and Live-Stream Gaming Market

- The live-streaming segment accounts for 63% of the video-streaming market. (Global News Wire, Maximize Market Research)
- 27% of gamers spend 1 to 5 hours streaming video games per week. (Forbes, 2024)
- 82% of consumers prefer to engage with a brand on a live stream rather than through social media posts. (LiveStream)
Streaming Types and Definitions
What is OTT?
“Over the top” (OTT) services refer to any type of video or streaming media that provides a viewer access to movies or TV shows by sending the media directly through the internet
*Collins English Dictionary
OTT Streaming Types and Examples
- SVOD = “subscription video-on-demand” in which a viewer sets up a monthly or yearly streaming subscription agreement for a flat monthly fee
- DTC = “direct-to-consumer” streaming service is when a network or streaming channel sells their service directly to the consumer bypassing retailers and wholesalers
- TVOD = “transactional video-on-demand”, which earn revenue via singular transactions “pay-per-view”
- AVOD = “advertising video-on-demand” services, which earn revenue from ads placed in streaming services
- FAST = “free ad-supported streaming TV services” are essentially live streaming services without the subscription and typically are an extension of traditional linear TV channels
Streaming Resources
Webcasts, Reports and Podcasts
This new study by CTAM and HarrisX, which examined the viewership experience of the Super Bowl LIX, revealed that streaming surpassed set-top box viewing for at-home audiences, but STBs provided a more reliable experience, with streamers—especially non-cable customers—reporting more issues.
2025 Evolution Of Sports: What’s the Score? Wave 3
As rights continue to shift across broadcast, pay TV, streaming, and direct-to-consumer, it is becoming increasingly important to understand the value of sports content for all stakeholders. Discover how fans and consumers value and consume sports and sports-adjacent content from live viewership to alternative broadcasts, sports betting, podcasts, and more.
TransUnion Whitepaper 2024: Better Understand Your Customers: Four Steps to Creating Actionable Segmentation
Did you know that 80% of consumers expect a personalized experience when shopping, and many will abandon their carts or choose a competitor if they don’t receive one? This report includes swift segmentation initiatives that achieve positive return, including:
- Using a segmentation to specifically address website personalization for unauthenticated visitors.
- Integrating internal and external data to provide depth, breadth and accuracy and a winning combination emerges when you bring all your first- and third-party data into single views of your consumers, supported by an authoritative identity methodology.
- Layering in multiple use cases: While there may be 50 distinct segments that “live” within your customer base, different slices of these 50 segments may be relevant for different marketing initiatives.
Visit TransUnion to learn more.
Content + Connectivity Consumer Insights: Opportunities for the Future Video Viewing Ecosystem
CTAM Commissioned Study with MAGID Research
June 2024
With consumers facing an ever-growing complexity of video service options, discover how to create a centralized experience to simplify, optimize and personalize their viewing experience.
2024 Evolution of the TV Set
Hub Entertainment Research
June 2024
In 2024, Smart TVs, with their advanced viewing features and declining prices, are becoming the dominant device for home TV and streaming, surpassing streaming media players due to their all-in-one convenience and improved operating systems that influence viewing habits.
CTAM Wired Webcast: Streaming TV’s Great Divide
January 25, 2024
Challenged budgets are impacting retail spend and fostering SVOD cycling as consumers pay 32% more for groceries and 26% more for general merchandise products then before the pandemic. Explore the resulting great divide between basic and premium TV and perceptions of bundles that offer MVPDs new revenue streams.
Thinking Out Loud Episodes

The Engagement Equation: Navigating Choice Overload for Viewer Success
Delve into how the explosion of streaming services and the era of Peak TV which has provided consumers with an unprecedented array of options, often leading to decision paralysis and choice
Marcien Jenckes, President of Xumo, on Engaging Audiences and Innovation
Uncover insights into a holistic approach aimed at captivating audiences and monetizing content through advertising
The Fusion of Tech, Content, and Partnerships in Entertainment
Explore how to navigate the ever-changing media landscape by utilizing new technology, data, and information to engage diverse audiences


